
Stay tuned for all the Daily Recaps and General Session on this multi page post!
Day 1:
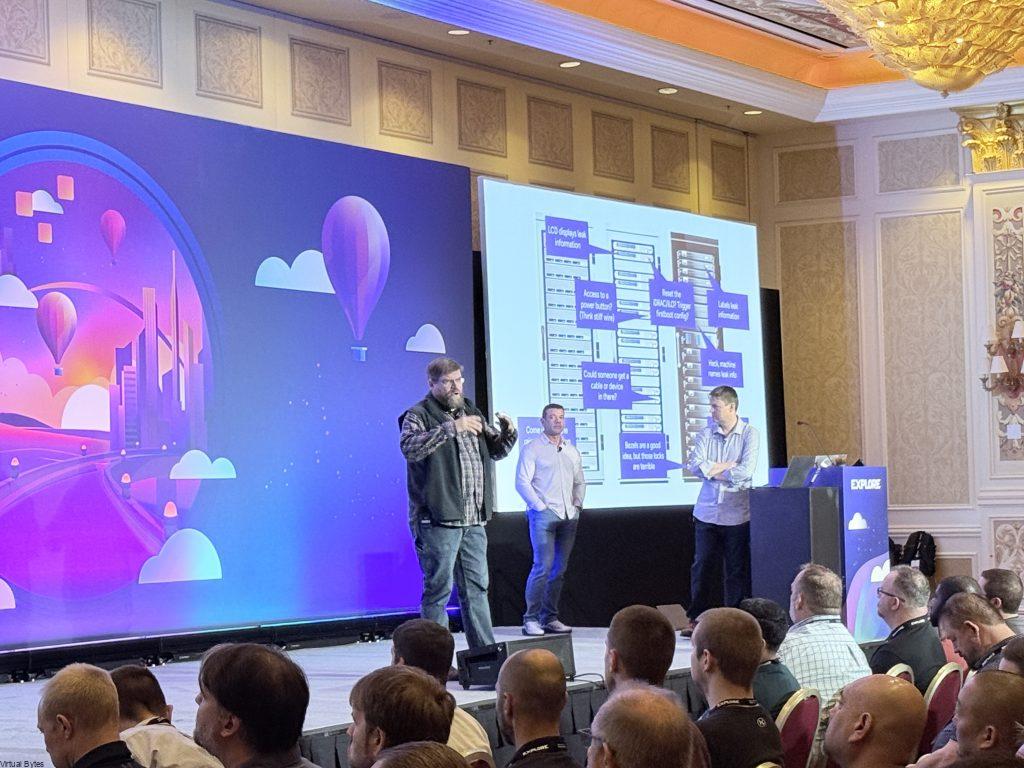
The first day of VMware Explore was filled with exciting events, from catching up with awesome friends and VMware employees to visiting vendors. It has been a fun-filled day, starting with waking up early and grabbing breakfast, then attending the first session with Bob Plankers, Dave Morera and John Nicholson.
Morning Session – A Hardware Smörgåsbord: Practical Tips and Tricks for Server Deployments [CLOT1774LV]:
Datacenter & Hardware Overview
- Focus on AI Workloads: AI models require massive amounts of computing power and memory, which translates directly into increased energy consumption.
- NVMe Memory Tiering (Dave Morera): This is the most exciting takeaway!
- What it is: Utilizing different tiers of memory (faster, more expensive NVMe vs. slower, less expensive options) to optimize performance and cost.
- Benefits:
- Performance Boost: Keeps frequently accessed data on the fast NVMe tier.
- Cost Savings: Moves less frequently accessed data to cheaper tiers.
- Scalability: Allows organizations to scale memory capacity without breaking the bank.
- Data Center Infrastructure Foundations: The session with Bob Plankers and Dave Morera clearly established the groundwork – understanding the core components of a data center (servers, storage) and the vital role of cooling.
- Power & Cooling – Critical for AI: The discussion around power usage and consumption, especially relating to AI workloads, is a huge topic right now. AI demands significantly more resources, and power/cooling are becoming major constraints.
- Memory Tiering – A Solution for Performance & Cost: Dave Morera bringing up NVMe Memory Tiering is fantastic. This is a smart and increasingly important approach to balancing performance with cost efficiency.
Memory Fundamentals
- Ranks: Understanding how memory modules are organized and how this impacts performance. (More ranks = potentially more performance, but also more complexity)
- Channels: How data flows through the memory subsystem. (More channels = higher bandwidth)
- DIMMs: The physical memory modules.
- Memory Types: different speeds and technologies like DDR4, DDR5, etc
- Bandwidth vs. Capacity: The trade-offs between having a lot of memory and being able to access it quickly.
Memory Access & Performance
- Memory Latency: The delay in accessing data from memory. (Lower latency is better)
- Memory Speed (Frequency): The rate at which data can be transferred.
- Memory Addressing: How the CPU locates data in memory.
- Non-Uniform Memory Access (NUMA): The impact of memory being physically closer to some CPUs than others (creating latency differences).
- Channels & Interleaving: How multiple channels and interleaving increase memory bandwidth.
Memory Optimization Techniques
- Tiered Memory: The core concept of using different memory types (or speeds) for different data based on access frequency.
- Hot Pages: Frequently accessed data – placed in faster (more expensive) memory.
- Warm Pages: Moderately accessed data.
- Cold Pages: Infrequently accessed data – placed in slower (less expensive) memory.
- Software-Driven Memory Management: Leveraging software to intelligently move data between memory tiers.
- Cost Savings: Reducing overall memory costs by utilizing tiered memory.
Key Takeaways & Actionable Insights
- Memory is Critical: Don’t underestimate the importance of memory in server performance.
- Tiered Memory is Powerful: Implementing a tiered memory system can significantly reduce costs and improve performance.
- Understand Your Workload: Analyze how your applications use memory to optimize tiering and configuration.
- Prioritize Compatibility: Always ensure that memory modules are compatible with your server.
- Software is Key: Leverage software tools for memory management and optimization.
- Monitor Memory Usage: Regularly monitor memory usage to identify bottlenecks and opportunities for improvement.
What Is New in Scripting GPU Management with PowerShell and Python [CODEQT1767LV]
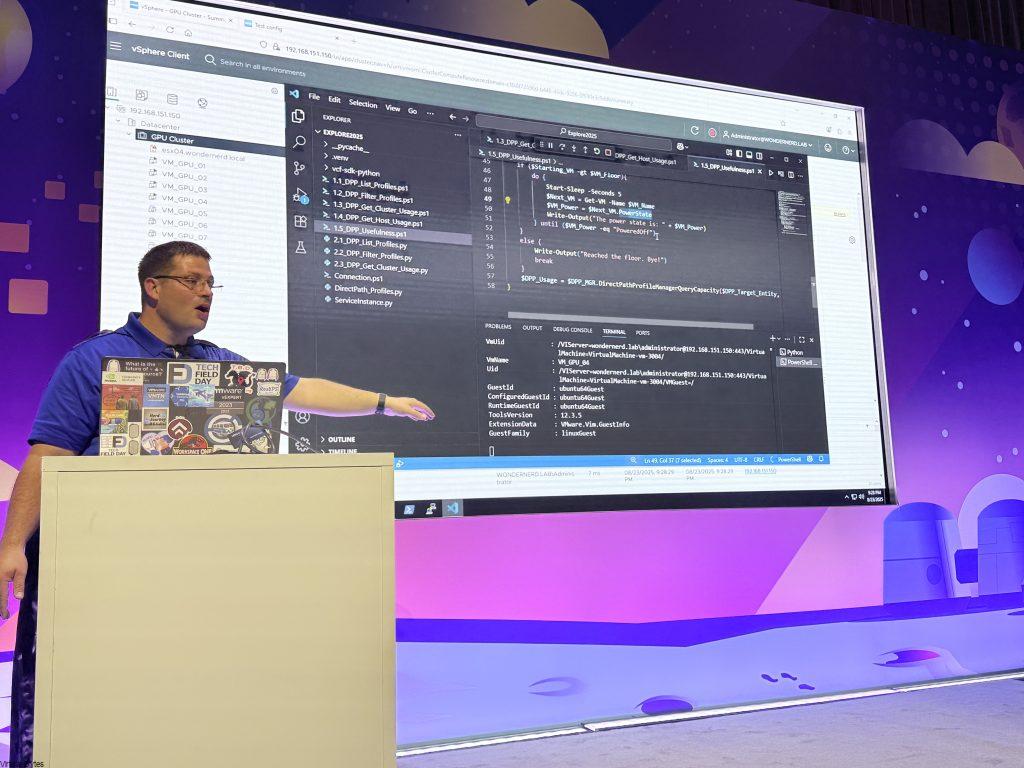
This session focuses on leveraging Direct Path Profiles – a key new feature for vGPU management – for programmatic control and monitoring of GPU resources in a vSphere environment. Tony Foster delivered an excellent demo and walkthrough of staging your PowerShell code to execute configurations and read metadata about GPUs and their configurations.
Key Takeaways:
- Direct Path Profiles: are now central to vGPU management, allowing granular control over GPU allocation and usage. You can view utilization within vCenter (Monitor tab) or through the Managed Object Browser (MOB) for function control for programmability.
- MOB Access: The MOB is disabled by default for security. It’s enabled by connecting to your VCSA via SSH
Enable the mob on vCenter 9.0
Connect to your VCSA via SSH
Backup the VPXD Configuration file

# cp /etc/vmware-vpx/vpxd.cfg /var/core/vpxd.cfg_backup

Edit the Configuration File: Open the vpxd.cfg file using a text editor (e.g., vi)

# vi /etc/vmware-vpx/vpxd.cfg

Identify the flag "enableDebugBrowse".If it's set to false or missing, change it or add it to true as shown below

   <vpxd>
   ...
     <enableDebugBrowse>true</enableDebugBrowse>
      ...
   </vpxd>

Save and close the file
Restart the vCenter Server Service (vpxd)

# service-control --stop vpxd
# service-control --start vpxd- Programming Focus: The session shows detailed configuration via programmatic access to Direct Path Profiles for automation and monitoring. Tony demonstrated how to:
- List Direct Path Profiles: Retrieve all or specific DPPs.
- Gather Utilization Data: Determine which VMs are using which profiles and remaining capacity.
- Target Queries: Focus queries on specific clusters or hosts.
- PowerCLI & Python Similarity: The code for interacting with Direct Path Profiles is very similar in both PowerCLI and Python, making it easier to transition between the two.
- Automation Example: Tony demonstrated a basic script that starts and shuts down six VMs based on available Direct Path Profile capacity, showcasing a practical application of programmatic control.
Prerequisites & Environment:
- GPU: NVIDIA GPU with a valid support contract.
- Driver: NVIDIA VGPU or Navi driver, using NVIDIA AI Enterprise driver.
- PowerCLI: v9
- Python: v3
The Hub
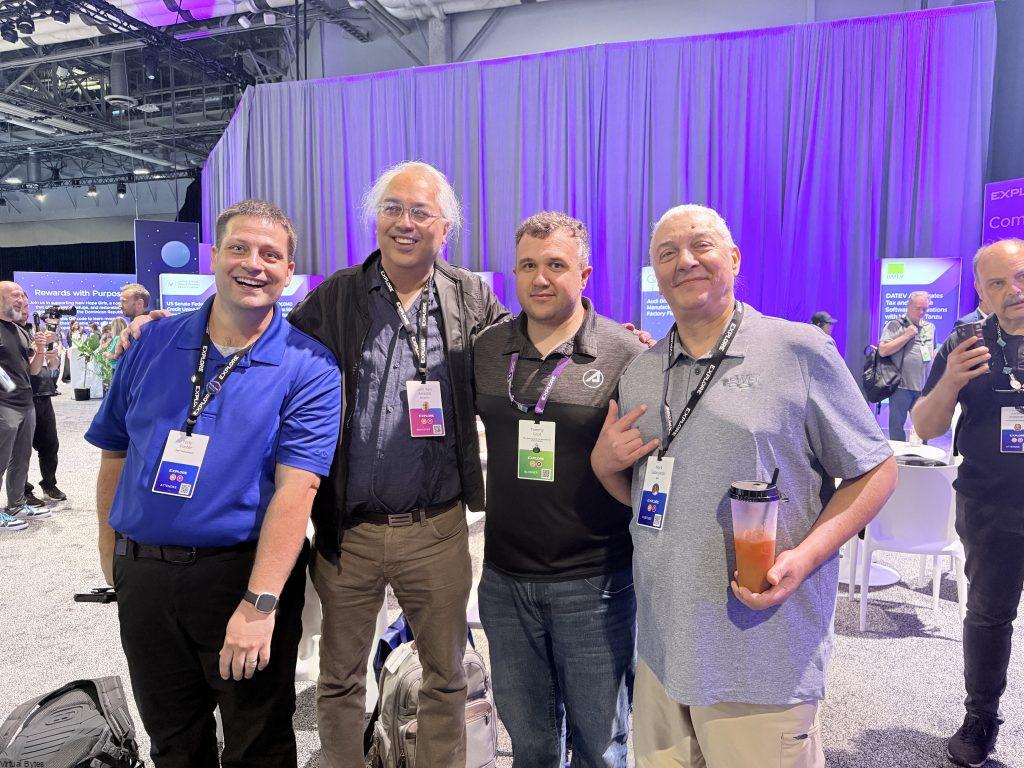
After the sessions, it was time to relax and kick back at The Communities lounge area. No VMware Explore is complete without the traditional photo of the OG VMware Family! The best part about these IT conferences isn’t rushing from session to session, feeling like you can’t breathe, but actually taking most of the day to network and talk about IT, Home Labs, Security, VMware, and more. These long hours spent chatting about VMware, projects we’ve done, or ideas we want to pursue offer invaluable knowledge – something worth more than anything. Learning and sharing stories are what truly make this event a dream come true!
Welcome Reception
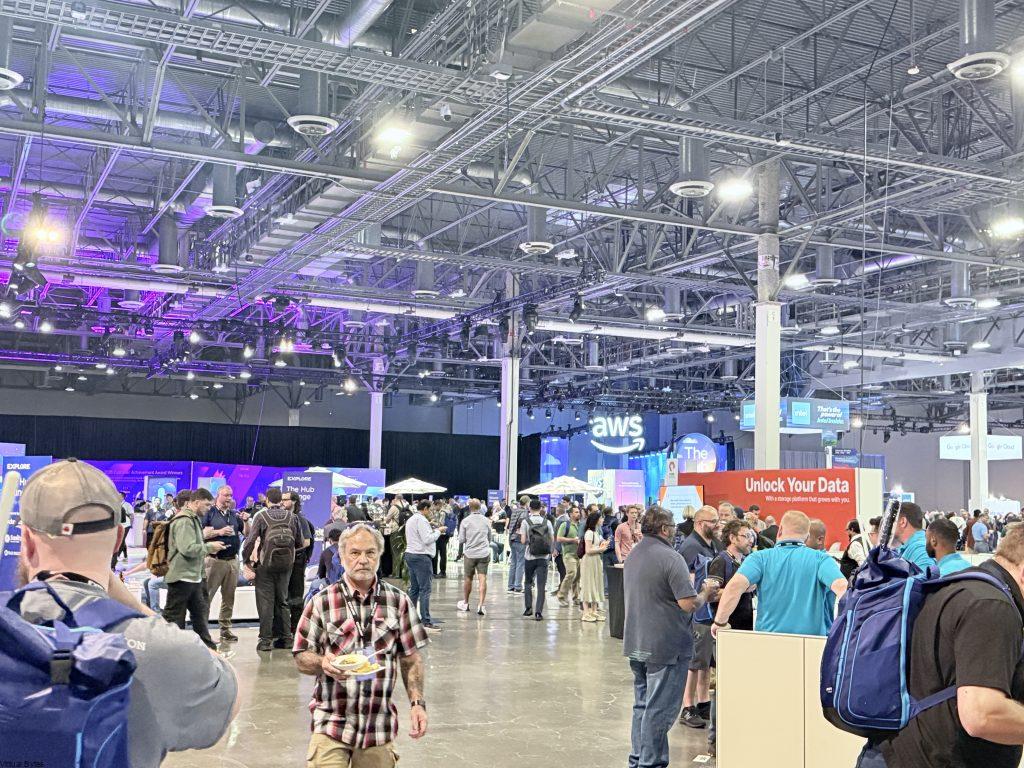
The Welcome Reception was bustling, combining The Expo with all the vendors, theaters, communities, lounge, and Hands-on Labs. It was a booming event, offering not only great food and drinks but also a fantastic opportunity to network with others and vendors and collect swag!