Unsupported: lab only
All of this was done in my home lab. A few of the steps (deleting keys directly from etcd, suspending Flux, running etcd outside of its StatefulSet) are not supported by Broadcom. If this happens to you in production, open a support case. Use this post to understand what you are looking at, not as a runbook.
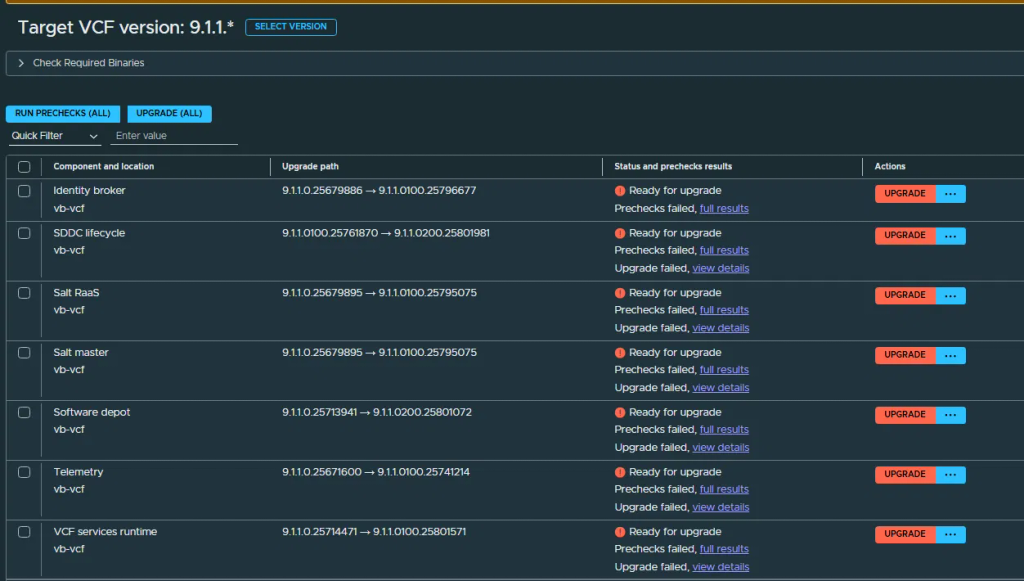
I went to patch the VCF management components in my lab to 9.1.1 and every single one failed prechecks. Identity broker, SDDC lifecycle, Salt RaaS, Salt master, software depot, telemetry, VCF services runtime. Seven rows of red, most of them also showing “Upgrade failed” from earlier attempts.
It took me most of a day and night to figure out. The cause was a support bundle that had written over four million log files into the platform’s object store. Each of those files is a key in an etcd database, the database grew to 2.8 GB, and etcd could no longer start before Kubernetes killed it. With etcd down, nothing else worked, including the upgrade.
This one is long. I’ve kept the full story because the details are what you need if you hit something similar, and there’s a command reference at the end if you just want the commands.
The environment
| VCF | 9.1.1, management components moving from 9.1.1.0 or 9.1.1.0100 to the 0100 and 0200 patches |
| VCF services runtime | 6 nodes (3 control plane, 3 workers), Kubernetes v1.35.6, Photon OS 5 |
| Platform etcd | vmsp-etcd StatefulSet, 1 replica, etcd 3.6.12 (FIPS build), 4 GiB PVC |
| Object store | SeaweedFS: 1 master, 1 filer, 3 volume servers with 75 GiB each |
| Storage class | vmsp-default, vSphere CSI, volume expansion allowed |
Everything interesting lives in the vmsp-platform namespace.
Where I started
Seven components failing together usually means one thing is broken underneath them. The other components get upgraded through SDDC lifecycle, so I opened its task first. One subtask, Stage SDDC lifecycle plugin in VCF services runtime, sat at “In Progress” forever, but its messages showed the stage prechecks had failed about a minute after it started:
Info   Staging binaries. Task ID: <task-id>
Info   Running Component Stage Prechecks. Status: Running
Info   Running Component Stage Prechecks. Status: Failed
That task ID is the useful part. Staging runs as an Argo workflow inside VCF services runtime, and the pods it creates are named after the task, so you can go straight from the UI to the pod logs:
kubectl -n vmsp-platform get pods | grep stage-component-<task-id>
kubectl -n vmsp-platform logs stage-component-<task-id>-execute-script-<n> --all-containers --tail=40
The UI also left the subtask “In Progress” after the failure. The workflow pod logs show an executor deadline about six hours out, so the task would have sat there for hours before giving up. Don’t wait on it.
Inside VCF services runtime
First thing I hit: kubectl does nothing on the worker nodes. There’s no admin kubeconfig there, so it tries localhost:8080 and gives up. Use one of the control plane nodes:
export KUBECONFIG=/etc/kubernetes/admin.conf
kubectl get nodes -o wide
kubectl get pods -A | grep -Ev 'Running|Completed'
If you’re stuck on a worker, the node agent keeps a copy of the runtime kubeconfig as a cached Secret at /var/cache/vmware/node-agent/resources/core.v1/Secret/vmsp-platform/vcf-runtime-kubeconfig.json. The control plane route is simpler.
The pod list printed a lot of failed job pods. Old staging attempts, backups, support bundle jobs. Buried in it were these two:
vmsp-platform   seaweedfs-filer-0   0/1   CrashLoopBackOff   1044 (3m31s ago)   3d18h
vmsp-platform   vmsp-etcd-0         0/1   CrashLoopBackOff   1687 (2m21s ago)   3d18h
Same age on both, so I figured they were connected. vmsp-etcd is not the etcd that Kubernetes itself uses. The platform runs its own single member etcd, and SeaweedFS keeps its file metadata in it. The filer log says so right before it dies:
filer store etcd: vmsp-etcd.vmsp-platform.svc.cluster.local:2379
F... failed to initialize store for etcd: error checking etcd connection: context deadline exceeded
The staging job pods had the last piece. Before they stage anything they call the platform’s synthetic health checker, filtered to the core components:
Synthetic health check starting with URL https://synthetic-checker.vmsp-platform.svc.cluster.local/status
  and QUERY selector=group notin (noncritical,sftp),component=vsp
Synthetic health check completed with curl exit code 0 and status code 218
Synthetic health check failed ... platform-statefulsets-core : 2 of 6 resources are not ok:
vmsp-etcd: wrong resource state: InProgress - Ready: 0/1;
Script exited unexpectedly at line 1 with exit code 218
Worth knowing: this check looks at the StatefulSet’s ready count, not at whether etcd answers on its Service. That comes back later. Even with a working etcd running somewhere else, staging stays blocked until vmsp-etcd-0 itself is Ready.
How it all depends on etcd
Once I could see the chain it made sense:
vmsp-etcdholds the SeaweedFS filer metadata (and other platform state)seaweedfs-filercan’t start without it, so the S3 API is down- Staging, component backups, support bundles and even the Postgres remediation jobs all read or write S3
- The staging health gate checks the etcd StatefulSet directly, so every upgrade precheck fails
The vidb Postgres remediation job is a good example of how far it spreads. Its log, from a run while the filer was still down:
Checking SeaweedFS health...
SeaweedFS master StatefulSet: 1/1 ready
SeaweedFS filer StatefulSet: /1 ready
ERROR: SeaweedFS filer StatefulSet is not ready
ERROR: Cannot remediate replicas when SeaweedFS is unavailable
Why etcd kept restarting
I expected a crash in the etcd log. There wasn’t one. It was a normal startup that just never got to the end:
opened backend db ... took 6.136102609s
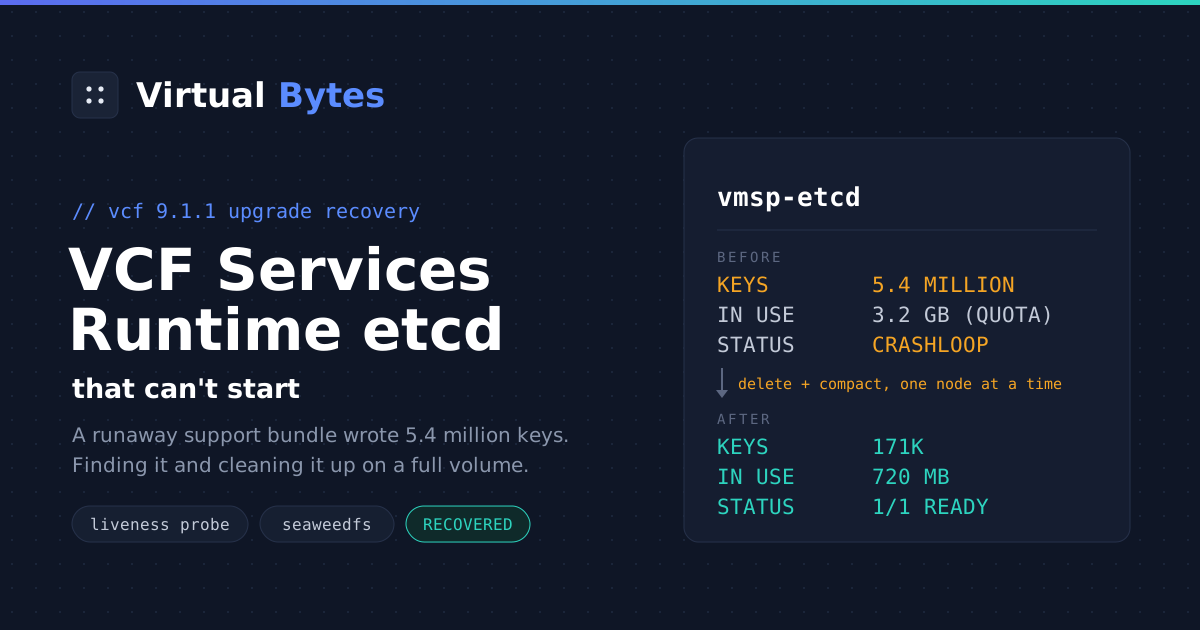
recovered v3 backend ... backend-size: 2.8 GB, backend-size-in-use: 2.8 GB
restored last compact revision ... 8615827
kvstore restored ... current-rev: 8643168          (about 30 seconds later)
enabled backend quota ... quota-size: 3.2 GB
starting initial corruption check ... timeout: 25s
The pod events explained it:
Normal   Killing    11m (x1686 over 3d18h)   kubelet  Container etcd failed liveness probe, will be restarted
Warning  Unhealthy  6m3s (x52280 over 3d18h) kubelet  Readiness probe failed: Get "http://...:8080/readyz": connection refused
Here are the probes on the StatefulSet. Note there is no startup probe:
| Probe | Endpoint | Initial delay | Period | Failure threshold |
|---|---|---|---|---|
| Liveness | /livez on 8080 | 15s | 10s | 3 |
| Readiness | /readyz on 8080 | |||
| Startup | none |
That works out to about 45 seconds for etcd to start serving. The container lasted exactly 40 seconds on each attempt (start and finish timestamps in lastState.terminated), which lines up. One odd detail if you go looking: the kill showed up as exitCode: 2, reason: Error rather than the usual 137 or 143, so don’t rule out the probe just because the exit code looks wrong.
The relevant bits of the etcd config, from the startup log:
| Setting | Value | Why it matters here |
|---|---|---|
quota-backend-bytes | 3221225472 (3 GiB) | Hit this and etcd raises a NOSPACE alarm and stops taking writes |
auto-compaction-mode / retention | periodic, 10h | Old revisions get cleaned up, but the file never shrinks without a defrag |
feature-gates | InitialCorruptCheck=true | Adds a full keyspace hash to every startup |
| Resources | request 50m CPU, 256Mi, no limits | Burstable. Can use as much memory as the node has, which bites later |
| Config file | /data/config.yml | Rendered onto the data volume by the etcd-init init container from the vmsp-etcd-config ConfigMap |
Why startup gets slower as etcd grows
Each startup phase scales with the data. Opening the bbolt file maps it into memory (the log shows an initial mmap size of about 3.5 GB). Restoring the kvstore walks every key to rebuild the in memory index. The initial corruption check computes a hash over the whole key space. With 5.4 million keys, those last two took 30 seconds and almost 3 minutes. Nothing is broken at that point, it’s just slow, and the probe doesn’t know the difference.
The quota was 3.2 GB and the volume 4 GiB, so it was close to full too. Size and “in use” were the same number, which meant a defrag wasn’t going to save anything. It was all live data.
Patching the probe didn’t stick
My first idea was to give the liveness probe a longer delay on the StatefulSet. A few minutes later my change was gone. The managed fields show who put it back:
kubectl -n vmsp-platform get sts vmsp-etcd --show-managed-fields \
  -o jsonpath='{range .metadata.managedFields[*]}{.manager}{"  "}{.operation}{"  "}{.time}{"\n"}{end}'

background-controller    Update   ...
helm-controller          Update   ...
kube-controller-manager  Update   ...
The annotations (meta.helm.sh/release-name: vmsp-etcd) give it away: the StatefulSet comes from a Flux HelmRelease, and helm-controller reverts anything you change. I suspended the HelmRelease:
kubectl -n vmsp-platform patch helmreleases.helm.toolkit.fluxcd.io vmsp-etcd \
  --type merge -p '{"spec":{"suspend":true}}'
It still got reverted, and when I scaled the StatefulSet to zero it got scaled back up. I never found out what else was doing that. Also note the background-controller entry, which is Kyverno. Its last write to this StatefulSet was right around when the crash loop started, three days earlier. My guess is that it triggered a rolling restart, and that restart was simply the first time etcd had to start since the data had grown too big. I can’t prove that though.
I stopped trying and worked around it instead.
Running etcd in a plain pod
The workaround was to build a regular pod from the StatefulSet’s own template, remove the probes, and mount the same volume. Nothing manages a plain pod, so nothing can revert it. Scale the StatefulSet down first because the volume is ReadWriteOnce:
kubectl -n vmsp-platform scale sts vmsp-etcd --replicas=0

kubectl -n vmsp-platform get sts vmsp-etcd -o json | jq '{
  apiVersion:"v1", kind:"Pod",
  metadata:{name:"etcd-rescue", namespace:"vmsp-platform", labels:{app:"etcd-rescue"}},
  spec:(.spec.template.spec
        | del(.containers[].livenessProbe, .containers[].readinessProbe, .containers[].startupProbe)
        | .hostname="vmsp-etcd-0" | .subdomain="vmsp-etcd"
        | .volumes += [{name:"etcd-data", persistentVolumeClaim:{claimName:"etcd-data-vmsp-etcd-0"}}])
}' > /root/etcd-rescue.json

kubectl apply -f /root/etcd-rescue.json
A few things about that pod:
- It keeps the
etcd-initinit container, certificates and config, so etcd starts exactly the way it would in the StatefulSet. - The volume has to be added by hand. In the StatefulSet it comes from
volumeClaimTemplates, which isn’t part of the pod template. - I gave it a different label on purpose, so the
vmsp-etcdService doesn’t route to it until I decide it should. - etcd takes its member name from the pod name, not the hostname. While the rescue pod ran, it published itself to the cluster as
etcd-rescuewith matching client URLs. The real pod published its own name again when it came back, so no harm done, but don’t be surprised by it in the logs.
The StatefulSet did get scaled back up again later. Its pod landed on another node and sat there with a Multi-Attach error, unable to get the volume while my pod had it. I was happy about that, it meant two copies of etcd couldn’t fight over the same data.
Without a probe killing it, etcd started fine. It just took a while:
| Startup step | Time |
|---|---|
| Open the bbolt database | about 8 seconds |
| Restore the key value store | about 17 seconds |
| Initial corruption check | 2 minutes 45 seconds |
| Election and ready to serve | about 7 seconds |
| Total | about 3 minutes 18 seconds |
The corruption check went well past its 25 second timeout. That timeout is about asking peers for their hashes, and a single member cluster has no peers, but it still hashes everything locally first. It passed. No corruption, the data was fine, there was just way too much of it.
Getting etcdctl working
This was more annoying than it should have been. Three things got in the way:
- The etcd image has no shell, so
kubectl exec ... shfails with “executable file not found”. - etcdctl is in the image, but the container sets
ETCDCTL_*environment variables, and etcdctl exits withconflicting environment variable is shadowed by corresponding command-line flagif you pass a flag that duplicates one of them. - The preset endpoint is
vmsp-etcd-0.vmsp-etcd. That per pod DNS record only exists behind a headless Service, andvmsp-etcdis a normal ClusterIP Service, so it doesn’t resolve.
What worked was an ephemeral debug container on the rescue pod, using the same etcd image from the platform’s internal registry. It shares the pod’s network, so 127.0.0.1 reaches etcd. It doesn’t get the preset variables. And with --target=etcd plus --profile=general it can read the certificates out of the etcd process through /proc/1/root:
D="kubectl -n vmsp-platform debug etcd-rescue -i --quiet \
  --image=registry.vmsp-platform.svc.cluster.local:5000/images/etcd:3.6.12-1 \
  --target=etcd --profile=general -- /usr/local/bin/etcdctl \
  --endpoints=https://127.0.0.1:2379 --insecure-skip-tls-verify \
  --cacert=/proc/1/root/etc/etcd/certs/client/ca.crt \
  --cert=/proc/1/root/etc/etcd/certs/client/tls.crt \
  --key=/proc/1/root/etc/etcd/certs/client/tls.key"

$D endpoint status -w table
$D alarm list
$D get "" --prefix --count-only -w fields | grep Count
Use the certificates under certs/client, not certs/server. The client listener is configured with the client CA. --insecure-skip-tls-verify is there because the server certificate doesn’t list 127.0.0.1.
Every call adds another ephemeral container to the pod spec, and they stay there until the pod is deleted. Sometimes you get a “couldn’t attach, falling back to streaming logs” warning because etcdctl finished before kubectl attached. You can ignore it, the output still shows up.
What was in there
5,438,759 keys. Trying to list them all timed out, so I pulled 30 keys to see what they looked like:
$D get "" --prefix --keys-only --limit=30 | grep -av '^$'

seaweedfs./buckets
seaweedfs./etc
seaweedfs./topics
seaweedfs./bucketssalt-raas.db.pgdatabase.wal-backup
seaweedfs./bucketssupport-bundle
seaweedfs./bucketssupport-bundle-<id>
...
How SeaweedFS lays out its keys
SeaweedFS uses one etcd key per file or directory. The key is seaweedfs., then the parent directory path, then a null byte, then the entry name. The null byte is why /buckets and support-bundle look glued together above. Three things follow from that:
- The entries directly under
/bucketsare your S3 buckets. - A prefix count on
seaweedfs./buckets/<bucket>counts everything inside that bucket, at any depth. It’s cheap even when a full listing isn’t. - A null byte sorts before
/, so when you list a directory prefix, its direct children come back first. A small--limitgives you the folder names without walking millions of keys.
Your grep and cut commands need -a, by the way. The null bytes make grep treat the output as binary and it prints nothing useful otherwise.
$D get "seaweedfs./buckets/support-bundle" --prefix --count-only --command-timeout=300s -w fields | grep Count
"Count" : 4200747
77 percent of everything was support bundles. That prefix also matches every support-bundle-<id> bucket, so I counted each bundle bucket separately. One of them had 4,094,067 keys on its own. The other eight were between 12 and 12,336 keys each.
Everything in the big one was under services-logs/vmsp-platform/, with one folder per node. Listing the folder names with the sort trick:
P="seaweedfs./buckets/support-bundle-<id>/services-logs/vmsp-platform"
$D get "$P" --prefix --keys-only --limit=1000 --command-timeout=120s \
  | grep -ao 'vmsp-platform.vcf-runtime-[a-z0-9]\{5\}$' | grep -ao 'vcf-runtime-[a-z0-9]\{5\}$' | sort -u
27 folders. The cluster has six nodes. Every worker that had ever been replaced still had its logs in there, and four of the folders held nearly all of it:
| Node folder | Keys |
|---|---|
| Replaced worker A | 2,129,714 |
| Current worker | 732,907 |
| Replaced worker B | 690,284 |
| Replaced worker C | 216,270 |
| The other 23 combined | about 330,000 |
One thing that threw me off. Before counting keys I’d tried fs.du in weed shell, and a bundle came back with only about 4,100 blocks and 1.7 GB, which made it look harmless. fs.du counts chunks, and small files get stored inline in the metadata with no chunks at all. So it tells you nothing about how many files there are. Count the keys.
If you want to use weed shell anyway, run it from the filer pod and point it at the master and filer explicitly. Without that it can’t connect and exits without printing anything:
kubectl -n vmsp-platform exec -it seaweedfs-filer-0 -- weed shell \
  -master=seaweedfs-master-0.seaweedfs-master.vmsp-platform:9333 -filer=localhost:8888
> fs.ls /buckets
[TODO: what created this bundle, and why the support-bundle-cleanup-bucket job never removed it.]
Stopping the writes
I made a mistake here. Before deleting anything I pointed the vmsp-etcd Service at my rescue pod so the filer could start again:
kubectl -n vmsp-platform get svc vmsp-etcd -o jsonpath='{.spec.selector}'
kubectl -n vmsp-platform label pod etcd-rescue app.kubernetes.io/component=etcd app.kubernetes.io/name=vmsp-etcd
Twenty minutes later the etcd revision had gone from about 8.64 million to 10.08 million, and the database had grown from 2.8 GB to the 3.2 GB quota. As soon as storage came back, something started writing support bundle data again. One more push and etcd would have gone read only.
Scaling the filer to zero got undone the same way the etcd changes did. So I cut it off on my end. I took the Service labels off the rescue pod so the Service had no endpoint. That alone isn’t enough, because the filer’s existing gRPC connection to etcd survives the endpoint going away (connection tracking keeps it alive). So I restarted the filer too. I also suspended the three support bundle CronJobs (cleanup-bucket, cluster-info-dump and collect-metrics):
kubectl -n vmsp-platform label pod etcd-rescue app.kubernetes.io/component- app.kubernetes.io/name-
kubectl -n vmsp-platform delete pod seaweedfs-filer-0

for c in $(kubectl -n vmsp-platform get cronjobs -o name | grep support-bundle); do
  kubectl -n vmsp-platform patch $c -p '{"spec":{"suspend":true}}'
done
After that, each delete bumped the revision by exactly one. Before, the gaps between my deletes were around a thousand revisions. That’s an easy way to confirm nothing else is writing.
Deleting with 600 MB free
A quick etcd storage refresher
This part only makes sense if you know how etcd handles deletes, so briefly:
- etcd keeps history. Every change creates a new revision, and old values stay in the database.
- A delete doesn’t remove anything. It writes a tombstone as a new revision. Right after a big delete, the database is bigger than before.
- Compaction drops all history older than a given revision, including the old values and the tombstones. That frees pages inside the bbolt file. “IN USE” goes down. “DB SIZE” doesn’t.
- Defrag rewrites the file without the free pages, which is what actually shrinks it on disk. It needs room for a full copy of the live data.
- The quota is checked against DB SIZE. If you hit it, etcd raises a NOSPACE alarm and only accepts reads and deletes until you free space and disarm the alarm.
The volume had 0.61 GB free. Deleting four million keys at once would add four million tombstones and could easily run the disk out of space halfway through. Running out of disk under bbolt is how you get real corruption. Defrag was out too, there was no room for the copy.
The plan
I deleted directly in etcd instead of through the filer. Going through weed shell would have meant millions of individual deletes and taken forever. The downside is that the bundle’s actual file data is still sitting on the SeaweedFS volumes until I run volume.fsck later. The volumes had about 65 GB free each, so that can wait.
I deleted one node folder at a time and ran a compaction after each. Compaction frees pages inside the file and the next delete reuses them, so the file doesn’t grow. --physical makes the compact command wait until the work is done, so the next delete doesn’t start on top of it.
To check free disk space on the etcd volume without logging in to the worker, ask the kubelet stats API:
avail(){ kubectl get --raw /api/v1/nodes/<node>/proxy/stats/summary \
  | jq -r '.pods[] | select(.podRef.name=="etcd-rescue") | .volume[] | select(.name=="etcd-data") | .availableBytes/1e9'; }
The loop, with a safety stop if free space drops below 0.25 GB:
P="seaweedfs./buckets/support-bundle-<id>/services-logs/vmsp-platform"
for n in $NODES; do
  a=$(avail); echo "== $n  avail=${a}GB"
  awk "BEGIN{exit !($a < 0.25)}" && { echo "LOW SPACE, stopping"; break; }
  $D del "$P/$n" --prefix --command-timeout=900s
  rev=$($D endpoint status -w json | grep -o '"revision":[0-9]*' | cut -d: -f2)
  $D compact $rev --physical --command-timeout=900s
done
If compact ever comes back with “required revision has been compacted”, it means that revision is already done and you’ve likely read a stale number. Check the status again before doing anything else.
Here’s how the numbers moved. Free disk on the volume stayed at 0.61 GB the whole time, which is what you want:
| Step | DB SIZE | IN USE |
|---|---|---|
| Start (after the write burst) | 3.2 GB | 3.2 GB |
| 23 small folders deleted and compacted | 3.2 GB | 2.0 GB |
| Two mid sized folders deleted, not yet compacted | 3.2 GB | 2.4 GB |
| Compacted | 3.2 GB | 2.0 GB |
| Biggest folder deleted, not yet compacted | 3.2 GB | 2.6 GB |
| Final compaction | 3.2 GB | 720 MB |
You can see the tombstones push IN USE up after each big delete, and compaction take it back down.
My SSH session dropped several times during all this, so two tips. Put your variables in a file you can source when you reconnect. And don’t run kubectl debug -i under nohup. With stdin closed it logs “read /dev/stdin: bad file descriptor”, you never see the etcdctl output, and the revision number your script reads back is garbage. The commands still run inside the pod, though, so check what actually happened before you rerun anything.
The OOM kill
The biggest folder had 2.1 million keys and I tried it in one delete. Bad idea. A delete range is applied as a single transaction, so etcd builds the whole thing in memory. etcd has no memory limit, but the worker it was on was already near full, and the kernel killed it partway through:
lastState.terminated: exitCode 137, reason OOMKilled

NAME          CPU(cores)   MEMORY(bytes)   MEMORY(%)
worker        1123m        14745Mi         102%
etcd-rescue   etcd         4508Mi
bbolt transactions are atomic so nothing was half deleted. This line in the restart log was the interesting bit:
newRaft ... term: 10, commit: 10220394, applied: 10211134, lastindex: 10220395lastindex is one higher than commit. The delete was sitting in the write ahead log as the last, uncommitted entry. A single member commits it as soon as it becomes leader, so etcd ran the delete again right after startup. That can turn into a loop: start, replay the delete, run out of memory, restart. Each round is safe but you never get anywhere.
The second time it had barely enough memory and it worked. If it hadn’t, I would have deleted the rescue pod and recreated it pinned to the node with the most free RAM (add .spec.nodeName to the JSON). The volume follows the pod. Next time I’d split anything that big into smaller deletes, one level deeper in the folder tree.
After the last compaction there were 171,109 keys left:
| Prefix | Keys |
|---|---|
| Remaining support bundles | 107,339 |
/topics | 61,301 |
| Four Postgres WAL backup buckets | about 2,400 |
/etc | 20 |
Giving it back to the StatefulSet
Startup time goes with the number of keys. At 171 thousand instead of 5.4 million, 45 seconds was plenty. I gave the volume more room first anyway. The vmsp-default StorageClass allows expansion, and vSphere CSI resized it while it was mounted:
kubectl get sc vmsp-default -o jsonpath='{.allowVolumeExpansion}'
kubectl -n vmsp-platform patch pvc etcd-data-vmsp-etcd-0 \
  -p '{"spec":{"resources":{"requests":{"storage":"8Gi"}}}}'
kubectl -n vmsp-platform describe pvc etcd-data-vmsp-etcd-0 | tail -8

Normal  ExternalExpanding           waiting for an external controller to expand this PVC
Normal  Resizing                    External resizer is resizing volume pvc-...
Normal  FileSystemResizeRequired    Require file system resize of volume on node
Normal  FileSystemResizeSuccessful  MountVolume.NodeExpandVolume succeeded for volume "pvc-..."
The whole thing took about a minute and the rescue pod never noticed. The StatefulSet’s volumeClaimTemplates still says 4 GiB, which is fine. Kubernetes doesn’t shrink an existing claim to match.
Then I deleted the rescue pod. vmsp-etcd-0 had been waiting on the other node the whole time. It got the volume as soon as it was released and came up with the stock probe:
vmsp-etcd-0   0/1   Init:0/1          0   9h
vmsp-etcd-0   0/1   PodInitializing   0   9h
vmsp-etcd-0   0/1   Running           0   9h
vmsp-etcd-0   1/1   Running           0   9h
Then I restarted the filer and checked that everything was healthy again:
kubectl -n vmsp-platform delete pod seaweedfs-filer-0
kubectl -n vmsp-platform get pod | grep -E 'vmsp-etcd|seaweedfs'
kubectl -n vmsp-platform get pods -w | grep -E 'backup|remediation'
Within a few minutes the backed up component backups were running and the upload-to-sftp steps were completing. Any backup or remediation pods that failed during the outage stay in Error. Their next scheduled run is what tells you if things are fine.
Last, before upgrading, put the platform back to how it was:
kubectl -n vmsp-platform patch helmreleases.helm.toolkit.fluxcd.io vmsp-etcd \
  --type merge -p '{"spec":{"suspend":false}}'
for c in support-bundle-cleanup-bucket support-bundle-cluster-info-dump support-bundle-collect-metrics; do
  kubectl -n vmsp-platform patch cronjob $c -p '{"spec":{"suspend":false}}'
done
kubectl -n vmsp-platform delete pod --field-selector=status.phase=Failed
Leaving the HelmRelease suspended would probably get in the way when VCF services runtime gets upgraded, since that upgrade is likely to ship a new etcd chart.
[TODO: upgrade outcome. Order used: SDDC lifecycle first, then VCF services runtime, then software depot, then the remaining components one at a time.]
Other causes of the same symptom
If your “Stage … in VCF services runtime” step fails its prechecks, etcd size isn’t the only possible cause. These two Broadcom KBs describe failures at the same stage, and they’re worth ruling out first because the fixes are much smaller:
- KB 452122: staging times out after about six hours because the
logging-operator-fluentdpod fails its readiness check (health checkVCFMS-HEALTH-002) after its log buffer piles up. Check withkubectl -n vmsp-platform get pods | grep fluentdand look for 0/1. - KB 441968: the URL connectivity precheck (
VCFMS-PRECHECK-URL-001) fails because the runtime can’t reach the component package on the depot.
The staging pod log tells you which one you have. Look for the health check line or the precheck code.
Things I’d avoid
- Don’t delete or recreate the etcd PVC to “start clean”. That’s the filer metadata for every bucket. Every backup and staged binary becomes unreachable.
- Don’t reach for
--force-new-cluster. It’s a single member cluster with healthy data. Nothing is wrong with membership. - Don’t defrag with less free disk than the “in use” size.
- Don’t start deleting while something is still writing. Check that the revision only moves when you do something.
- Don’t do one giant delete range on a node with little free memory.
Still on my list
- Defrag
vmsp-etcd-0. The file is still 3.2 GB on disk with 78 percent free inside it. Now that the volume is 8 GiB there’s room, and with 720 MB of data the pause should only be a few seconds. - Run
volume.fsckinweed shellto reclaim the orphaned file data from the deleted bundle. - Find out what produced the bundle and why cleanup failed (the TODO above).
- Send feedback to Broadcom that
vmsp-etcdshould have a startup probe. A liveness probe with a 15 second delay and no startup probe means a large but healthy etcd can never come back on its own.
What I’d tell myself next time
Don’t trust the UI when everything fails at once. The useful error was in a staging job pod log inside VCF services runtime, and nothing in VCF Operations pointed there.
CrashLoopBackOff doesn’t always mean the app is crashing. etcd was fine. It was getting killed for being slow.
Stop patching objects that a controller owns. You’ll lose. Run the thing in a plain pod and get on with it.
Deletes in etcd use space until you compact. On a tight volume, do small batches with a compaction after each, and save the defrag for when you have room.
Find whatever is writing and stop it before you start deleting. I didn’t, and I lost an hour to it.
Catching it before it breaks
A simple check against the running vmsp-etcd-0 would have caught it. Same debug container approach as above, just pointed at the real pod. This prints DB size and in use size as a percentage of the quota:
export KUBECONFIG=/etc/kubernetes/admin.conf
D="kubectl -n vmsp-platform debug vmsp-etcd-0 -i --quiet \
  --image=registry.vmsp-platform.svc.cluster.local:5000/images/etcd:3.6.12-1 \
  --target=etcd --profile=general -- /usr/local/bin/etcdctl \
  --endpoints=https://127.0.0.1:2379 --insecure-skip-tls-verify \
  --cacert=/proc/1/root/etc/etcd/certs/client/ca.crt \
  --cert=/proc/1/root/etc/etcd/certs/client/tls.crt \
  --key=/proc/1/root/etc/etcd/certs/client/tls.key"

QUOTA=3221225472
$D endpoint status -w json 2>/dev/null | jq -r --argjson q $QUOTA \
  '.[0].Status | "db \(.dbSize/1e6|floor) MB (\(.dbSize*100/$q|floor)%)  in use \(.dbSizeInUse/1e6|floor) MB (\(.dbSizeInUse*100/$q|floor)%)"'

$D get "" --prefix --count-only -w fields | grep '"Count"'
$D get "seaweedfs./buckets/support-bundle" --prefix --count-only -w fields | grep '"Count"'
I’d start worrying at around 50 percent of quota or a key count in the millions. Remember this adds an ephemeral container to vmsp-etcd-0 each run, so don’t schedule it every five minutes.
And check that the support bundle cleanup job actually works. If these keep showing Error, bundles are piling up:
kubectl -n vmsp-platform get pods | grep support-bundle-cleanup-bucket
kubectl -n vmsp-platform get cronjobs | grep support-bundle
Command reference
Everything in one place, in roughly the order I used it. Run from a control plane node of VCF services runtime.
# Access
export KUBECONFIG=/etc/kubernetes/admin.conf

# What's broken
kubectl get pods -A | grep -Ev 'Running|Completed'
kubectl -n vmsp-platform logs stage-component-<task-id>-execute-script-<n> --all-containers --tail=40
kubectl -n vmsp-platform logs vmsp-etcd-0 --previous --tail=60
kubectl -n vmsp-platform describe pod vmsp-etcd-0 | tail -30
kubectl -n vmsp-platform logs seaweedfs-filer-0 --previous --tail=40

# Probe and last exit
kubectl -n vmsp-platform get pod vmsp-etcd-0 -o jsonpath='{.spec.containers[0].livenessProbe}{"\n"}{.status.containerStatuses[0].lastState.terminated}{"\n"}'

# Who owns the StatefulSet
kubectl -n vmsp-platform get sts vmsp-etcd --show-managed-fields \
  -o jsonpath='{range .metadata.managedFields[*]}{.manager}{"  "}{.time}{"\n"}{end}'

# etcd status and counts (with $D defined as above)
$D endpoint status -w table
$D alarm list
$D get "" --prefix --count-only -w fields | grep '"Count"'
$D get "seaweedfs./buckets/<bucket>" --prefix --count-only --command-timeout=300s -w fields | grep '"Count"'
$D get "<prefix>" --prefix --keys-only --limit=30 | grep -av '^$'

# Delete and compact
$D del "<prefix>" --prefix --command-timeout=900s
rev=$($D endpoint status -w json | grep -o '"revision":[0-9]*' | cut -d: -f2)
$D compact $rev --physical --command-timeout=900s
$D defrag --command-timeout=600s          # only with free disk larger than IN USE
$D alarm disarm                           # only if alarm list shows NOSPACE

# Node memory and volume space
kubectl top nodes
kubectl get --raw /api/v1/nodes/<node>/proxy/stats/summary | jq '.pods[] | select(.podRef.name=="<pod>") | .volume[]'
This post describes work done in a lab and proof of concept environment and is provided as is, with no warranty. It is not affiliated with, endorsed by, or supported by Broadcom or VMware.