Caution: lab and PoC only
Everything here was done in my own home lab. The rightsizing script itself comes from a Broadcom KB and is supported, but several steps in this post go beyond it: deleting pods to get past PodDisruptionBudgets, and setting worker values by hand with vmsp pkg configure. Neither is a documented procedure.
Every node rollout described here replaces your worker nodes one at a time and briefly restarts platform databases. Do not run any of it against production without a maintenance window, current backups, and a conversation with Broadcom support first. Try it at your own risk.
VCF 9.1.1 shrinks the VCF Management Services worker nodes for Day-0 deployments. If you patched up from 9.1.0 instead of deploying fresh, you don’t get the new sizing automatically, and there’s a KB with a remediation script that re-applies it for you.
The script itself is fine. It did exactly what it said it would. The part that cost me an hour was the node rollout afterwards, which stalled on the first worker it tried to drain and sat there doing nothing visible for a very long time.
Here’s what was actually happening, and how to get ahead of it.
What I was working with
Most of the writeups I’ve seen on this rightsizing use a Simple (non-HA) deployment, where the headline is that you end up with one fewer worker node. Mine is Small HA, which is new in 9.1.1, and that changes the maths.
platform profile:  small
worker size:       medium
machineType:       management.medium
minReplicas:       3
ha:                true
fleet FQDN:        set
Day-N components:  none installed
Worker size sitting at medium against a small platform profile is the symptom the KB describes. Run those values through the script’s case statement and the small plus HA plus fleet path lands on management.small with minReplicas of 3.
I already had 3 workers. So on Small HA you don’t lose a node at all, and the whole benefit is the machine type dropping from medium to small. Still worth having across three VMs, but if you read the release notes and expected a worker to disappear, it won’t.
The script also refuses to run if either Day-N component is installed, so Log Management or Real-time Metrics being present will stop you before anything changes. I’d removed Log Management earlier the same evening, which is what made the cluster eligible in the first place.
Getting onto a control plane node
This has to run on a VCFMS control plane node because it calls the local vmsp CLI. That binary only exists on the cluster nodes. A jumpbox with kubectl and a copied kubeconfig gets you through two of the three prerequisite checks and then stops dead, so don’t bother.
Working out which of your runtime VMs is a control plane node is fiddlier than it should be. The names are random suffixes with nothing role-related in them, and the Fleet LCM component list doesn’t give you a role column. It is in the API, just not in the summary. Dump one node object and there it is:
curl -sk "https://${FLEET}/fleet-lcm/v1/components/${VSPID}" \
  -H "Authorization: Bearer ${TOKEN}" | jq '.nodes[0]'

{
  "nodeType": "control-plane",
  "id": "...",
  "fqdn": "10.0.10.166",
  "ipAddress": "10.0.10.166",
  "name": "vcf-runtime-k4tbq"
}
So for the full list:
curl -sk "https://${FLEET}/fleet-lcm/v1/components/${VSPID}" \
  -H "Authorization: Bearer ${TOKEN}" \
  | jq -r '.nodes[] | [.nodeType, .name, .ipAddress] | @tsv' | sort
If you’d rather not go near the API, port 6443 tells you the same thing, since only control plane nodes serve the Kubernetes API:
for ip in 10.0.10.161 10.0.10.163 10.0.10.164 \
          10.0.10.166 10.0.10.167 10.0.10.169; do
  printf '%-16s ' "$ip"
  timeout 3 bash -c "</dev/tcp/$ip/6443" 2>/dev/null \
    && echo "6443 open, control plane" \
    || echo "6443 closed, worker"
done
Both agreed on my cluster. Worth knowing that the runtime ingress FQDN resolves to a VIP which isn’t one of the nodes, so don’t try to SSH to it like I did.
SSH to the runtime cluster is off by default and you enable it from VCF Operations. Log in as vmware-system-user and elevate. On my nodes su - kept failing because root has a separate password, but sudo -i works with the vmware-system-user password.
Running it
No complaints about the script. It checks its prerequisites, bails out if a Day-N component is installed, bails out on a consumption cluster, prints what it’s about to do, and makes you type yes. The line I’d check before confirming is this one:
Scenario: small, HA, fleet -> machineType 'management.small', minReplicas '3'.Then it submits the change and polls the PackageDeployment every two minutes for up to two hours.
Two things about that monitor. There’s no tmux or screen on the Photon nodes, so either run it in the foreground and accept that losing your SSH session costs you the monitor (the rollout carries on server side regardless), or wrap it in nohup. And it’ll tolerate fifteen consecutive Failed phases before giving up, so one Failed reading partway through isn’t necessarily the end of the world.
Where it stalled
Mine sat in Progressing for ages. The phase field doesn’t tell you much, so I went looking at the machines instead:
kubectl get machines -AThat’s a lot more useful. You get two MachineSets, old and new, which you can tell apart by the hash in the machine name. I had two new workers already up and healthy, one old worker stuck in Deleting, and one old worker still Running but flagged as not up to date.
Describing the stuck one gave me the answer straight away:
Message: * Deleting: Machine deletion in progress since more than 15m,
  stage: DrainingNode, delay likely due to PodDisruptionBudgets

Message: Drain not completed yet:
* Pod vcf-sddc-lcm/vcf-sddc-lcm-db-0: cannot evict pod as it would
  violate the pod's disruption budget. The disruption budget
  postgres-vcf-sddc-lcm-db-pdb needs 1 healthy pods and has 1 currently
Why it can’t fix itself
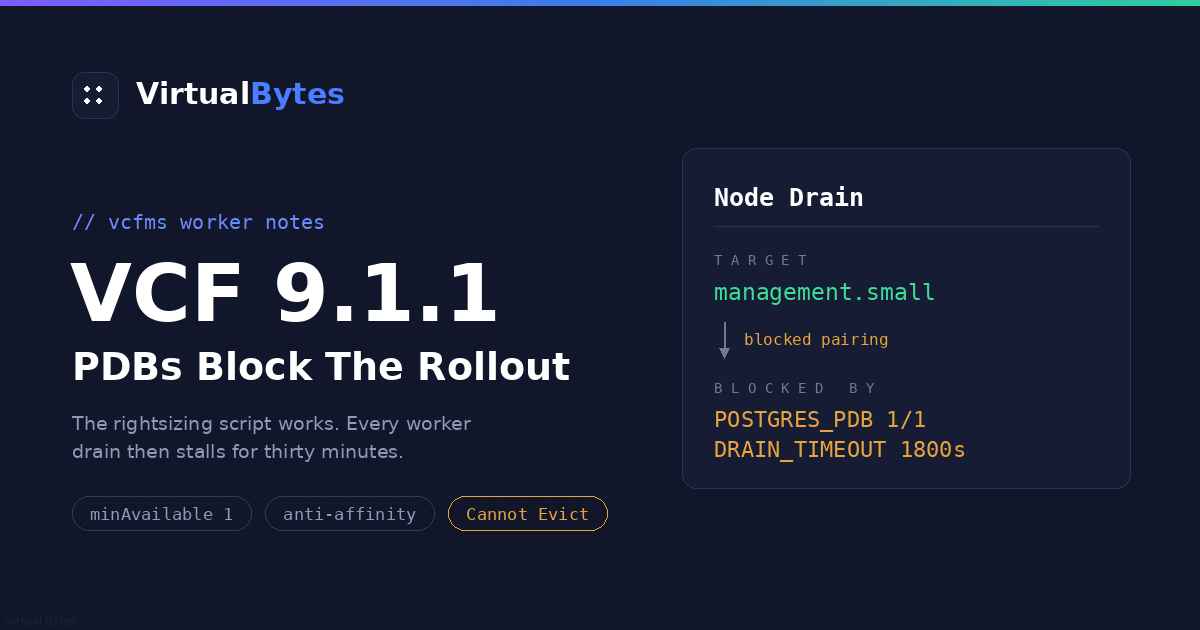
VCFMS runs several Postgres instances under the Zalando operator, and every single-replica instance gets a PodDisruptionBudget with minAvailable: 1. Sensible default for stopping someone draining a database by accident. Completely unsatisfiable when there’s only one replica.
One healthy pod, budget wants one healthy pod, evicting it takes you to zero. The eviction API says no, and it’ll keep saying no forever.
There’s a second piece to this that took me a while to spot. Those Postgres pods also carry pod anti-affinity, so they won’t schedule alongside each other. With three of them and three workers, you get exactly one database per worker, every time. I watched that hold across five separate rollouts and it never varied.
Which means it isn’t that some node drains happen to hit a blocked pod. Every node drain hits one, by construction. The anti-affinity guarantees the distribution and the PDB guarantees each one blocks. If you’re wondering whether you’ll get lucky and have it sail through, you won’t.
What eventually breaks the deadlock is the CAPI timeout:
kubectl get machinedeployment -n vmsp-platform -o yaml \
  | grep -iE 'nodeDrainTimeout|nodeVolumeDetachTimeout|nodeDeletionTimeout'

nodeDeletionTimeoutSeconds: 1800
nodeDrainTimeoutSeconds: 1800
nodeVolumeDetachTimeoutSeconds: 1800
Thirty minutes, then CAPI stops trying to drain and deletes the VM anyway. The rollout does finish without you touching anything, which is probably why this hasn’t been written up much. But your Postgres doesn’t get a graceful shutdown out of it. It comes back on the new node and does WAL crash recovery. In my case that was the SDDC LCM database and the Identity Broker database, and I’d rather neither of those crash recovered if I can help it.
There’s a knock-on effect too. Once the pod is finally evicted it gets rescheduled, and with three workers there’s a good chance it lands on another old node that hasn’t been replaced yet. Mine did precisely that, so the same database blocked two separate drains in one rollout.
Clearing it
A PodDisruptionBudget only applies to the eviction API. Delete the pod directly and it goes, and the StatefulSet puts it straight back. The data’s on a PVC so it follows the pod.
Cordon any old workers still standing first, otherwise the pod can land on one and block the next drain:
kubectl cordon <remaining-old-worker>Check the data really is on a volume before you delete anything:
kubectl get pvc -n vcf-sddc-lcmThen:
kubectl delete pod -n vcf-sddc-lcm vcf-sddc-lcm-db-0
kubectl wait -n vcf-sddc-lcm --for=condition=Ready \
  pod/vcf-sddc-lcm-db-0 --timeout=180s
Both of my Postgres pods were back and fully ready inside thirty seconds. The vSphere CSI detach and reattach added almost nothing. The blocked drain cleared about a minute later. You do get a very short outage of that one service, which is what you booked the maintenance window for.
Don’t try patching the PDB. It’s operator managed and gets reconciled back.
Doing it properly next time
Finding these one node at a time turned a twenty minute job into ninety. If I ran it again I’d work out which pods are going to block before starting, and move them all up front.
kubectl get pdb -ALook at ALLOWED DISRUPTIONS. Anything on 0 is a hard block. On my cluster that came to the three Zalando Postgres instances (SDDC LCM, Fleet LCM, Identity Broker), the Identity Broker service, and four single-replica platform deployments including the identity service, the proxy service and the platform agent itself.
Then see what’s on the node that’s about to be drained. DaemonSet pods get ignored by drains so filter them out:
kubectl get pods -A --field-selector spec.nodeName=<node> \
  | grep -v -E 'antrea|kube-proxy|csi-node|node-exporter|kube-vip|fluentbit|tailer|metadata-service|problem-detector|logcopier|configure-node'
Whatever appears on both lists is what you need to move. One at a time, waiting for each to come back before starting the next, and leave the platform agent till last since it’s the thing running the rollout. For the deployments use a delete followed by rollout status rather than just deleting and hoping.
Anything with more than one replica will drain on its own while you’re working through the list, so pod names go stale fast. I lost a couple of delete commands to NotFound because CAPI had already got there. No harm done.
One thing I got wrong early on, worth saving you the same worry. I assumed cordoning every old worker risked leaving a pod with nowhere to schedule. It doesn’t, because there’s a cluster-autoscaler on the worker pool with a max of 20. When I cordoned everything at once, a database sat in FailedScheduling for about two minutes and then the autoscaler quietly scaled the MachineDeployment from 3 to 4 and built it somewhere to live. It scaled back down to 3 on its own once the rollout settled.
So minReplicas is a floor, not a fixed node count, and cordoning aggressively is safe. You might end up briefly paying for an extra worker, which is a fair trade against pods bouncing between nodes that are all about to be deleted anyway.
How it ended up
Three control plane nodes untouched the whole way through, which was the bit I cared about. Three workers replaced onto the new machine type. PackageDeployment went to Successful, and the whole thing came in just under an hour including the time I lost to the first stall.
You’ll see a pile of failed backup workflow pods in the platform namespace afterwards. They’re scheduled incremental backups that ran while their databases were being moved around, and they’re all timestamped inside the rollout window. The next scheduled run succeeds and the failed pods get cleaned up on their own. Check one post-rollout run goes green and then ignore them.
Then I undid the whole thing
An hour later I reinstalled Log Management, mostly to see what would happen. What happened is that it reverted the rightsizing and then some.
before the rightsize:   management.medium
after the rightsize:    management.small
after adding Logs:      management.large   16 vCPU / 32 GB
Not back to where I started. Two sizes past it. Installing a Day-N component recomputes the worker profile, a new MachineSet appears, and all three workers roll again onto the larger type. Same PDB deadlock, same three databases, second time through.
Here’s the size comparison, caught while I still had both running side by side:
NAME                CPU      MEM
control plane       3920m    8604792Ki     4 vCPU / 10 GB
small worker        9905m    14796412Ki   10 vCPU / 16 GB
large worker        15890m   30362772Ki   16 vCPU / 32 GB
Across three workers that’s roughly 18 vCPU and 48 GB of difference. Which is most of the reason you’d have run the rightsizing in the first place.
Why it can’t just reschedule onto the existing nodes
This was my first instinct too. The small workers weren’t anywhere near saturated, so why replace them instead of putting the new pods on what’s already there.
Because the worker size is a property of the MachineDeployment, not a scheduling decision. CAPI treats machine type as immutable, so there’s no resize in place for a running machine. Any change to that field means a new VSphereMachineTemplate, a new MachineSet, and a full rolling replacement. The old nodes aren’t being kept and topped up, they’re being retired because their template no longer matches the declared spec, spare capacity or not.
The sizing also isn’t derived from live utilisation. It’s a fixed lookup from the deployment profile and the installed component set.
And no, you can’t force Logs onto the small ones
I tried. You can set the values by hand and they’ll stick:
vmsp pkg configure vmsp-platform -n vmsp-platform \
  --set cluster.worker.size=small \
  --set cluster.worker.machineType=management.small \
  --set cluster.worker.minReplicas=3
The PackageDeployment accepts it, the template re-renders at 10 vCPU and 16 GB, and the rollout starts. Then you look at what Log Management actually asks for:
kubectl get pods -n ops-logs -o json | jq -r '.items[]
  | .metadata.name + " " + ([.spec.containers[].resources.requests
  | "cpu=" + (.cpu // "-") + " mem=" + (.memory // "-")] | join(", "))'

log-processor-0      cpu=3   mem=6Gi,  cpu=100m mem=128Mi
log-store-0          cpu=5   mem=10Gi
plugin controller    cpu=500m mem=500Mi
That’s 8600m and 16.6 Gi of requests against 9905m and about 14.1 Gi allocatable on a small worker. Memory alone is over by two and a half gig before a single platform pod or DaemonSet lands on the node. log-store-0 on its own wants 5 CPU and 10 Gi.
So the large profile isn’t the platform being cautious. The component’s own resource requests genuinely don’t fit on a small worker. Force it and you get log-store-0 sitting in Pending with insufficient memory, and Log Management is down until you put the profile back.
It’s a real either-or. Keep Log Management and run large workers, or don’t install it and keep small ones. There’s no middle setting, and no supported way to pin the component to a separate smaller pool, because there’s only one worker pool and its size is a single value.
Which means the order matters
Decide your Day-N components first. Install them. Then, and only if you’re certain you’re staying Day-0-only, run the rightsizing.
Running the script and adding Log Management afterwards costs you the entire saving plus two avoidable rollouts through the PDB deadlock. I did exactly that, then removed Logs again to get back to small, which was a third. Five worker rollouts in one evening, and three of them were self-inflicted.
A bug in the cleanup script worth knowing about
Removing Log Management uses a different KB and a different script, cleanup_component.py, run from SDDC Manager. The second time I ran it, this happened:
Successfully deleted component 'e41eca06-...' from Fleet.
Waiting 120 seconds before checking...
Component 'e41eca06-...' does not exist in Fleet (HTTP 404).
Deleting component 'e41eca06-...' from VSP...
Delete task initiated (ID: kuw5p7ojzbfb7cnfnkmd2tgfma)
Task status: PENDING | Elapsed time: 0s
Task status: QUEUED | Elapsed time: 30s
Delete task ended with status: QUEUED
Look at the polling loop in the script. It continues on RUNNING and PENDING, returns on SUCCEEDED, and treats everything else as a failure with sys.exit(1). QUEUED isn’t in that list, so the first time the VSP task reported QUEUED the script gave up and exited with an error.
The task was fine. It was queued, it ran, and the component was removed about fifteen minutes later. But for that quarter of an hour the cluster looked genuinely broken: Fleet had no record of the component, the VSP runtime still had it installed and Running with no deletion timestamp, and a scheduled backup for it had just started. I was halfway through gathering evidence for a support case when it completed on its own.
Two things to take from that. Don’t re-run the delete when you see this, because the Fleet record is already gone and a second attempt has nothing to work from. And don’t go anywhere near the finalizer on the Component CR. Just wait and keep checking:
kubectl get components -A -o json | jq -r '[(.items // [])[]
  | select(.metadata.name=="ops-logs") | .metadata.name]'
Empty means it’s genuinely gone. My first run never surfaced QUEUED at all, it went straight from PENDING to RUNNING, so this doesn’t happen every time.
One thing I’m not sure about
I hit the first block on a cluster where Log Management had come out shortly beforehand, so the SDDC LCM database had been rescheduled recently and happened to be sitting on a node due for replacement. At the time I wondered whether that was just bad luck with pod placement.
Five rollouts later I don’t think it is. The anti-affinity puts one database on each worker every time, and the PDB blocks every one of them. It reproduced identically on every single node drain across the whole evening, including on a cluster state I hadn’t touched in between. If yours doesn’t do this, I’d be interested to know why.
Either way kubectl get pdb -A takes two seconds and tells you what you’re in for.
The whole thing start to finish
William Lam has already covered the happy path for this, and the KB has the official version, so I wasn’t going to write another walkthrough. But the PDB pre-staging changes the order you’d want to do things in, so here’s the full run with that folded into it.
1. Check you’re actually eligible
Every VCFMS component needs to be on 9.1.1 or later, and neither Day-N component can be installed. The script enforces both, but there’s no point getting as far as a maintenance window to find out.
If you’re removing Log Management specifically to become eligible, that’s a separate KB and a separate script (cleanup_component.py, run from SDDC Manager). Do that first and let it finish completely.
2. Find a control plane node
Either from VCF Operations under Build, Lifecycle, VCF Management, Components, VCF Services Runtime and scroll to the nodes table, or from the Fleet LCM API as above. Get a token first:
TOKEN=$(curl -sk -X POST "https://${RUNTIME}/api/v1/identity/token" \
  -H 'Content-Type: application/x-www-form-urlencoded' \
  --data-urlencode 'grant_type=password' \
  --data-urlencode '[email protected]' \
  --data-urlencode "password=${VSPPASS}" \
  | jq -r .access_token)
The password for [email protected] is the vmware-system-user password. Then find the VSP cluster and list its nodes:
curl -sk "https://${FLEET}/fleet-lcm/v1/components?includeConsumptionVsp=true" \
  -H "Authorization: Bearer ${TOKEN}" \
  | jq -r '.components[] | select(.componentType=="VSP")
      | [.id, (.vspCluster.type // "-"), .version] | @tsv'

curl -sk "https://${FLEET}/fleet-lcm/v1/components/${VSPID}" \
  -H "Authorization: Bearer ${TOKEN}" \
  | jq -r '.nodes[] | [.nodeType, .name, .ipAddress] | @tsv' | sort
3. Enable SSH and get onto the node
SSH to the runtime cluster is disabled by default. Turn it on from VCF Operations, which is also where you get the vmware-system-user password if you don’t have it.
ssh vmware-system-user@<control-plane-ip>
sudo -i
export KUBECONFIG=/etc/kubernetes/admin.conf
command -v kubectl jq vmsp
All three have to resolve. Turn SSH back off when you’re done.
4. Read the current sizing before you change it
kubectl get pd vmsp-platform -n vmsp-platform -o json | jq '{
  platform: .spec.values.profiles.name,
  worker:   .spec.values.cluster.worker.size,
  ha:       .spec.values.cluster.ha,
  type:     .spec.values.cluster.type,
  fleet:    .spec.values.ingress.fleet.fqdn
}'

kubectl get pd vmsp-platform -n vmsp-platform -o json \
  | jq '.spec.values.cluster.worker'

kubectl get components -A -o json | jq -r \
  '[(.items // [])[] | select(.metadata.name=="ops-logs"
    or .metadata.name=="vcf-obs-data-platform") | .metadata.name]'
The last one has to come back empty. Write down the worker block, because that’s what you’ll compare against afterwards. If machineType already matches what the script’s case statement would set for your profile, there’s nothing to gain and you’d be rolling three nodes for no reason.
5. Map the PodDisruptionBudgets
This is the step that isn’t in anyone else’s walkthrough, and it’s the one that saves you an hour.
kubectl get pdb -ANote everything with ALLOWED DISRUPTIONS of 0. Those are your blockers. Cross-reference against each worker to see where they’re sitting:
for n in $(kubectl get nodes -l '!node-role.kubernetes.io/control-plane' \
             -o name | cut -d/ -f2); do
  echo "=== $n ==="
  kubectl get pods -A --field-selector spec.nodeName=$n \
    | grep -v -E 'antrea|kube-proxy|csi-node|node-exporter|kube-vip|fluentbit|tailer|metadata-service|problem-detector|logcopier|configure-node'
done
Now you know in advance which pods will need moving and roughly when.
6. Copy the script over and check it survived
chmod +x /tmp/rightsize-day0-workers.sh
bash -n /tmp/rightsize-day0-workers.sh && echo "syntax OK"
If you pasted it in with vi rather than scp’ing it, do the syntax check. Autoindent will quietly mangle the heredoc and the nested case blocks.
7. Run it
/tmp/rightsize-day0-workers.shType yes at the prompt. Check the Scenario line matches what you expect for your profile before it goes any further, because that’s the last point where nothing has changed yet.
8. Watch the machines, not the phase
Open a second SSH session. The script’s own monitor only tells you Progressing, which is true but useless.
kubectl get machines -AWhen a machine goes to Deleting and stays there, describe it and look for the drain message. If it names a PDB, cordon the remaining old workers and move the pod as above.
9. Verify
kubectl get pd vmsp-platform -n vmsp-platform
kubectl get nodes -o wide
kubectl get pods -A | grep -v -E 'Running|Completed'

kubectl get nodes -o custom-columns=\
'NAME:.metadata.name,CPU:.status.allocatable.cpu,MEM:.status.allocatable.memory'
PackageDeployment on Successful, all nodes Ready, and the workers visibly smaller than the control plane nodes. Cross-check the VM hardware in vCenter if you want the actual vCPU and memory numbers you got back.
Then tidy up. Remove the script from the node, turn SSH back off on the runtime cluster, and expect a batch of failed backup workflow pods that’ll sort themselves out.


